I think soft data is showing the way, but many disagree.
subscriber
am/FX
TOD Flipper and Supply Pains
Time of day patterns in foreign exchange are surprisingly persistent and have never been more relevant.
Read now


I think soft data is showing the way, but many disagree.


The golden age of fraud is ready to accelerate with assistance from AI.
Short USDJPY @ 150.40
Stop loss 151.66
Take profit 148.26
Buy EURUSD 1.0711
(Limit order)
Stop loss 1.0484
One of the most important decisions you have to make in macro right now is whether or not to believe the soft (sentiment) data. For the first time in 4 years, I believe it. There is this feeling that the soft data has been wrong for ages, and so it will continue to be wrong, but I think that view misses the reason that the sentiment data has been a red herring so far in this cycle. This is not hindsight, as I have been saying over and over through 2022 and 2023 and 2024 that weakness in the soft data is simply a matter of how sentiment data works, and not a harbinger of future economic weakness. Now, using the same logic, the soft data is probably foreshadowing significant economic weakness.
The reason that soft data didn’t work in 2022/2024 is that it’s a rate of change measure, and we were coming off the hottest US economy in memory. Remember how restaurants were closing in summer 2021 because of a worker shortage? NFP beat expectations 14 months in a row. Retail Sales were strong just about every single month. The economy was absolutely on fire and overheating after the mega fiscal tsunami post-COVID.
Then, things slowed from overheated to normal, matching the speed of the pre-COVID economy. This led to a rapid drop in sentiment indicators because those surveys ask business and consumers how they are feeling relative to before. Worse, obviously! They couldn’t possibly feel better than they felt during the biggest economic boom ever. You got severely misguided headlines like this one.

If you are on Twitter, you will remember the nonstop flurry of breathless tweets saying negative M2 was portending the end of the world because that “has literally never happened before!” Fire emoji! Downward sloping line emoji! But the view was wrong because it misunderstood the first vs. second derivative. Now, people are pivoting to a new logic that soft data doesn’t matter because it didn’t matter before. But the starting conditions are completely different now.
Imagine a car that usually goes 50mph (solid economy) but slows down to 25mph sometimes (recession). Your rate of change models will accurately show recession. But if the car goes from 50 to 100 back to 50, your rate of change models will signal recession when in fact all that happened was the car was speeding and now it’s back to its normal velocity.
Here’s a chart of what that would look like.
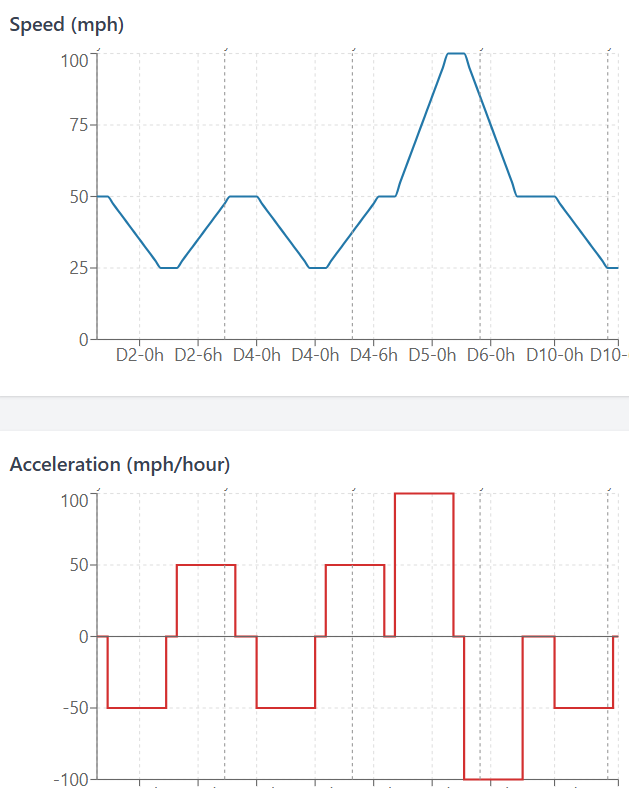
The blue line is the speed of the car (economic growth) while the red line is the second derivative (survey data). You see survey data will correctly go negative in recession when the starting point is normal. But when the starting point is 100mph, the acceleration data (aka, the soft data) will show mega danger. Now that we are back to normal economic speed in 2024/2025, the drop in survey data should accurately show economic danger, like it usually did pre-COVID.
I would also mention that not all the hard data looks great. Atlanta Fed’s gold-adjusted GDPNow model currently shows negative GDP growth for Q1. It has been the best predictor of GDP for years, and is reflecting negative contributions from government spending, consumer spending, and private inventories. It’s also reflecting a huge negative contribution from net exports, but that series is hard to read (even excluding gold) because tariffs are creating all sorts of weird incentives to buy now ahead of rising prices.
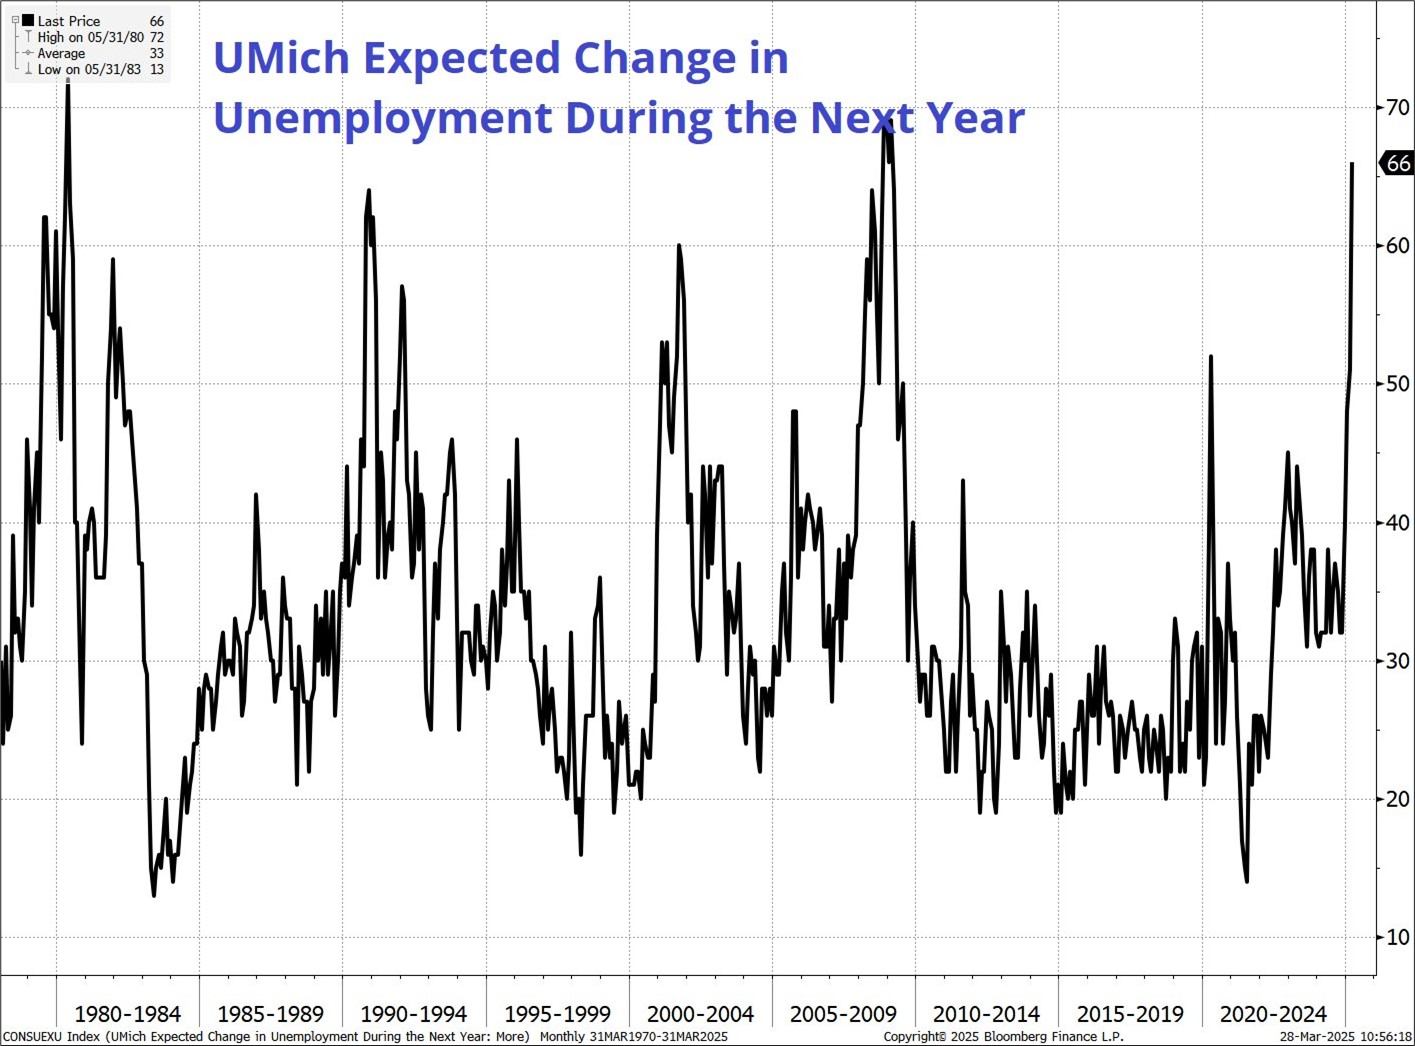
All this to say: Ignore charts like this one from UMich at your peril. Sure, sample sizes and political bias are making survey data kind of weird, but when survey data collapses off an economic baseline that looks a lot like 2016-2019, there is much more reason for concern than when it collapsed off the economic superspike of 2021.
Policy uncertainty and fiscal retrenchment are freezing hiring and investment in and outside the USA.
The dollar does not always have to rally when stocks sell off. JP Morgan recently introduced the idea of the USD smirk and that is a good framework for the dollar after periods of massive inflows into US assets.

Their framework is about Fed response function, but I would argue that the USD will not rally on equity weakness anymore because the equity selling comes from foreigners who have been piling into US assets for the past 10 years.
When Canadian, Swedish, Dutch, or Norwegian pension funds reduce US equity overweights, they sell USD because their holdings aren’t fully hedged.
There is considerable career risk for foreign owners of US assets now as the US political situation becomes hostile to foreign entities. In the 1993 to 2003 period, when the NASDAQ did an up and down similar to the one now, the correlation between the DXY and the SPX was positive. This next chart is a scatter of monthly SPX and DXY returns, colored by the different regimes from 1993 to now. I copied this idea from Alf’s most recent Macro Compass. It’s a fantastic publication and you can subscribe here.
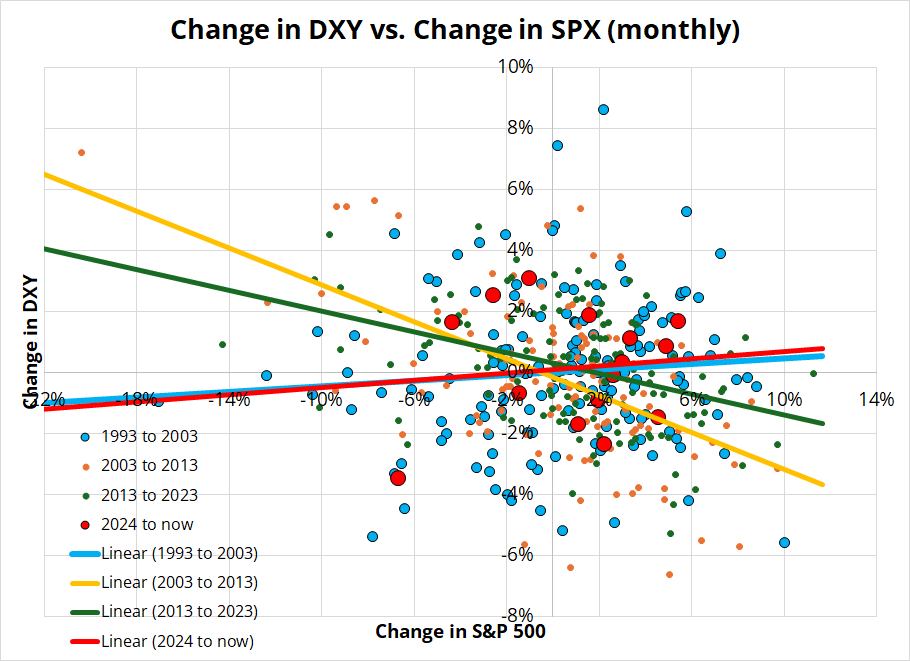
Ignore the dots and look at the trendlines. The dotcom bubble period is cyan (blue) and current period (small sample size) is red. You can clearly see there are two regimes for the dollar and we’re probably in the second one.
The DXY is mostly European currencies (57% EURUSD, plus some CHF and SEK). In contrast to the DXY, AUDUSD remains positively correlated with equities in all regimes. See next chart.
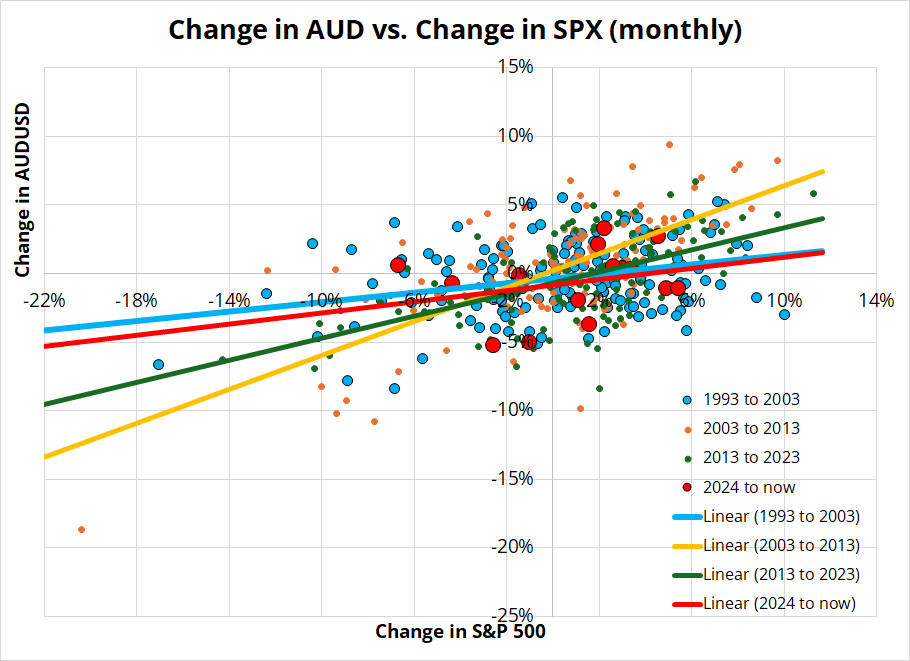
We are probably in a regime similar to the one from 1993 to 2003 but with the added kicker that the US political story suddenly makes US equity overweights even more repugnant to foreign holders than they were after the bursting of the dotcom bubble.
The implication is that you should not expect EURUSD to go down just because US stocks are going down. Alf also pointed out to me that buying a dual digital playing for lower SPX and higher EURUSD would take advantage of a change in correlation, if it continues. Agree.
It’s all about the hard data now, as the non-believers in the soft data will need to capitulate if the hard data rolls over. I think Atlanta Fed GDPNow is showing the way, but many series like Initial Claims are failing to play ball with the recessionistas so far. This week’s hard data includes JOLTS, ADP, Factory Orders, Claims, and NFP.

Good tweet from Jens Nordvig questioning the “removal of uncertainty” view. I had put forth the view last week that once April 2 comes and goes, we will have greater certainty on economic policy and so risky assets could rally. I have lost conviction on that view as the tariffs look like they will not be permanent, and instead could be the start of a painful and demoralizing bargaining process. If I was long risky assets, I would rather see 25% across-the-board permanent tariffs than all this wishy washy chaos. Smoke signals from the administration increasingly point to more wishy washy chaos.
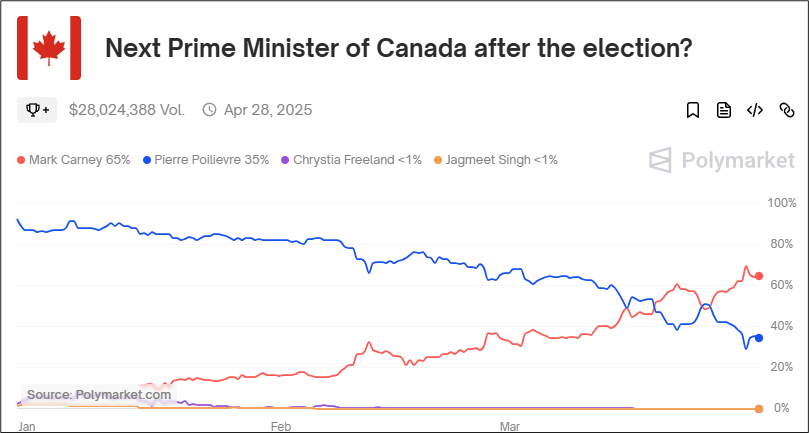
And here’s Pierre Poilievre’s plan to boost Canadian investment. Thanks CClark.
Month-end flows from real money are likely to be USD buy, so going short USD at 4pm London today (especially long EURUSD) makes a lot of sense. I am going to leave my EURUSD bid where it is for now, and see what transpires today at WMR. The USDJPY short is doing fairly well despite a mega bounce off 148.70.
Have an honest day.
The golden age of fraud is ready to accelerate with a helping hand from AI.
“You can use 4o to generate fake receipts.
There are too many real world verification flows that rely on “real images” as proof. That era is over.”
Time of day patterns in foreign exchange are surprisingly persistent and have never been more relevant.
The base case is obvious so it’s time to think about the alternative hypothesis