
Lesson 3: Surfing the Narrative Cycle
Understand the stories the market is telling itself

Mastering markets is not just about numbers. It’s not just about solving equations or analyzing fundamentals or tossing number salad. You must take the time to appreciate how stories and narratives drive capital markets. You need to understand the facts, the numbers… And the stories. The key to understanding the stories the market is telling itself is to analyze and anticipate the narrative cycles that drive your assets and the economies and markets you follow.
This is true at every fractal. Whether you are an analyst covering microcap technology companies, or a hedge fund portfolio manager trading global macro, you always need to know the current state and path of the narratives driving both your markets, and the world economy.
This lesson will help you understand and forecast the evolution of narrative cycles. Lesson 4 will follow up and go deeper into a particularly rare and extreme (and important) narrative cycle: market bubbles.
First, let’s dig into why you must understand how stories influence markets.
Why stories matter
Decisions to take action in markets and in the world economy are made by human beings, and by computers programmed and operated by human beings. Those human beings are wild-eyed dreamers and fearmongering haters. Human beings buy high and sell low. Some are risk averse and some love to gamble. And they all love (love!) a good story. They are nothing like the robotic and rational “homo economicus” imagined by John Stuart Mill.
Who is homo economicus? Homo economicus is an imaginary character who plays a leading role in many economic models. He is the dominant species in the Land of Theory. Homo economicus is a person with infinite capacity to make rational decisions, who has perfect access to information, and who is exclusively motivated by self-interest. Does that sound like anyone you know? Infinite capacity to make rational decisions. LOL. Many economic theories are rooted in the idea that humans, in aggregate, behave like homo economicus.
Sure, in aggregate, human beings often have an incredible capacity to be effective and efficient. Therefore, as a whole, markets are very efficient. And as individuals, humans have some capacity to make rational and consistent decisions. But if we could neatly model human beings and they were consistently rational creatures, there would be no cycles of fear and greed.
Nobody would ever buy tech stocks at 182 times earnings. And nobody would ever pull their bid in stocks that are “on sale” simply out of fear. Because it makes zero economic sense to do either of these. Therefore, we don’t reject the idea of rationality wholesale, and we don’t reject the idea of high efficiency. We reject the ideas of perfect rationality and perfect efficiency. We reject the assumption that humans are always homo economicus. When you reject such a major assumption, it punches a hole in a good chunk of theoretical economics.
If we reject the homo economicus model of human behavior and instead assume moments where humans show extreme irrationality, follow perverse and broken incentives, and have asymmetrical or missing information, then we need to get a better understanding of human beings in order to have a proper understanding of markets.
Human beings as a species have always placed huge importance on storytelling. Stories weave information and emotion in a way that sticks with us more durably than information or data alone. This is why so much teaching and communication involves storytelling. Since the beginning of humanity, stories have been the primary way humans transmit information.

A telling of the Epic of Gilgamesh, circa 2500 BCE
Note that when you hear the word “story,” you might initially think: fiction—stories of make believe. When your teacher says you had quite the “story” for why you didn’t complete your history assignment, her implicit implication is that you are lying.
But stories and narratives are often true!
When we talk about stories and narratives in this lesson, there is no implicit judgment of whether or not the stories are true. Sometimes they are, sometimes they are not. In markets, most of the stories the market embraces have a considerable amount of objective truth to them, though obviously the market also trades off rumors and falsehoods. And sometimes the market doesn’t care if a story is true, as long as there is money to be made.
The risk is most often not that market narratives are false, it’s that markets overcommit and exaggerate the importance of stories or focus on story too much and forget about the objective limitations imposed by the real world.
The important thing to know is that good stories provoke people into action, whether the stories are true or false. We pass information to others via good, compelling stories. You tell me a good story, I repeat it, and it spreads, like a virus. Humans recall stories much more easily than data, especially when the story has emotional resonance.
Facts and data are not inherently viral. Good stories are. This is the power, and danger of narratives in markets. Market narratives can be fun, exciting, interesting, and easy to understand. They can also be scary and provocative and titillating. And they will lead you over a cliff if you don’t stay rational.
By understanding narrative, you equip yourself to act as a rational outside observer of the herd and avoid getting sucked in by viral, emotional stories. As a market story goes viral, you must watch dispassionately as the crowd goes mad.
“Oh, interesting, look what they’re doing. That doesn’t look very rational.”
Most stories in the market are based on some objective truth but market stories morph and expand and become cartoonified over time and end up disconnected from reality. Your job as a true market professional is to keep both feet in reality at all times.
Narratives: Putting the “fun” in fundamentals
Not long ago, as recently as the 1980s, economic and market analysis was dominated by a concept called “fundamental analysis.” Fundamental analysis takes an analytical and mathematical point of view as it attempts to find an objective current or future value for asset prices, economic growth, and markets. Fundamental analysis attempts to derive or calculate accurate numerical estimates and it’s an ongoing race to develop and implement the best models and tools.
Starting in the 1990s, this all changed. Here’s how Howard Marks put it:
In the past, bargains could be available for the picking, based on readily observable data and basic analysis. Today it seems foolish to think that such things could be found with any level of frequency. If something about a company can be easily read in an annual report, or readily discovered by a mathematically competent analyst or computer, it stands to reason that, in most cases, this should already be appreciated by the marketplace and incorporated in the prices of the company’s securities. That’s the essence of the Efficient Markets Hypothesis.
Thus, in the world we live in today, investing on the basis of rote formulas and readily available fundamental, quantitative metrics should not be particularly profitable. (This is not necessarily true during market downturns and panics, when selling pressure can cause prices to decouple from fundamentals).
Excel and Python and Bloomberg and FRED and other platforms have democratized access to information. Unlimited computer processing power at almost zero cost has leveled the technological playing field. Massive financialization and a huge influx of graduates to the world of finance since the 1980s has created exponentially higher competition compared to the 1970s or 1980s. There are so many CFAs, quants, and Python jockeys, and 130 IQ Ivy League grads in finance that it’s extremely difficult or impossible to have an edge by just crunching numbers harder or finding mispriced assets.
As Marks put it when I interviewed him in 2019: “Market inefficiency is mostly cyclical now. In the past it was structural.”
What he meant was that structural inefficiencies that once existed are gone and will never come back. Pre-internet, there was alpha sitting around all over the place. Anyone with a calculator, a basic understanding of DCF, and a strong work ethic could scoop up that alpha because markets were structurally inefficient.
Now, markets are structurally efficient and veer into inefficiency only during cyclical periods of extreme emotion. You either need to use a behavioral approach, or you need to understand the companies, industries, and technologies way better than anyone else. That level of understanding requires a much deeper knowledge than one can obtain with publicly-available data.
In a world where capital markets are evolving fast, access to information is approaching infinity, and the cost of compute is headed towards zero, fundamental analysis is moving towards higher and higher levels of efficiency. On the other hand, human incentives, bias, greed, and fear have barely changed at all in the past 200 years.
In periods of extreme fear or greed, narrative, sentiment, and positioning dominate. This inefficiency will never be arbitraged away by bigger, faster computers.
This tweet from December 2020 (a period of panic liquidity injections, maniacal narrative chasing, and extreme greed) captures how markets feel about fundamentals when narratives are in control.

https://twitter.com/SimpleJackCap/status/1341388555839528960
Analysts, economists, and traders with expert knowledge of narrative and behavioral economics plus a solid working knowledge of fundamentals will outperform the more-proficient fundamental analyst who has a poor understanding of human behavior.
Narrative and Behavioral economics + Fundamentals > Fundamentals
Data plus stories gives you the deepest possible understanding of capital markets.
Fundamentals are just a theoretical anchor
While nobody agrees on the same fundamental value for any given asset, even assets with consensus fair values oscillate widely around that fair value. For example, while many still agree that future cash flows ultimately determine the value of a company’s equity, the multiple assigned to those future cash flows is constantly changing. One year, price-earnings ratios could be 12X and the next they might average 21X. Or, while a company might be certain to go bankrupt in the next few years, its stock could still triple tomorrow if the meme stock apes get hold of it.
Perhaps on some infinite theoretical time horizon, asset prices do converge towards their true worth, but on all shorter time scales, they can oscillate based on liquidity, geopolitics, narratives, greed, fear, FOMO, and so on. This idea of homo economicus sitting there calculating fair values and then methodically taking asset prices towards a stable equilibrium is about as useless a framework as you could ever possibly have in your head if you want to participate in the real world of capital markets. A more accurate framework is this:
“In the short run the market is a voting machine. In the long run, it is a weighing machine.”
This quote, attributed to Ben Graham by Warren Buffett, is useful. It means that the market oscillates above and below long-run equilibrium (fair value) because speculators and their emotional trading decisions drive short-term price action. In the long run, fundamentals matter. But then again:
“The long run is a misleading guide to current affairs. In the long run we are all dead.”
John Maynard Keynes, 1923
This concept of market time or behavioral time should not be underestimated. It is one of the greatest gaps between theory and practice in finance. This excerpt, from Cory Hoffstein’s 15 Ideas, Frameworks, and Lessons from 15 Years explains it nicely.
Behavioral Time is decades longer than Statistical Time
I recently stole this one from Cliff Asness. This point has less to do with any practical portfolio construction thoughts or useful mental models. It’s just simply acknowledging that managing money in real life is very, very, very different than managing money in a research environment.
It is easy, in a backtest, to look at the multi-year drawdown of a low-Sharpe strategy and say, “I could live through that.” When it’s a multi-decade simulation, a few years looks like a small blip—just a statistical eventuality on the path. You live that multi-year drawdown in just a few seconds in your head as your eye wanders the equity curve from the bottom left to the upper right.
In the real world, however, a multi-year drawdown feels like a multi-decade drawdown. Saying, “this performance is within standard confidence bands for a strategy given our expected Sharpe ratio and we cannot find any evidence that our process is broken,” is little comfort to those who have allocated to you. Clients will ask you for attribution. Clients will ask you whether you’ve considered X explanation or Y. Sales will come screeching to a halt. Clients will redeem.
For anyone considering a career in managing money, it is important to get comfortable living in behavioral time.
Returning to the subject of fair value and fundamentals, now. This next chart shows the Shiller Cyclically Adjusted Price-Earnings ratio over the last 145 years. You can see that stocks oscillate loosely around a fair value of approximately 17X earnings. The weighing machine tries to keep stocks anchored to earnings, but the voting machine can keep stocks beaten down and cheap (e.g., 1970 to 1985) or ebullient and overpriced, for years (e.g., 1929, 2000, 2021).
If you are a big valuation buff, and decided only to go long stocks when the market P/E is below its historical average, you have been out of the market since, umm… 1993 or so? The S&P 500 is up 1000% since then. You missed quite a rally.
Valuation can be useful at the mega extremes, especially for individual stocks. But valuations anywhere near historical averages mean nothing. A 16X or 22X price-earnings ratio is effectively the same thing once you adjust for myriad other factors that impact equity valuations.
Shiller CAPE, 1880 to now

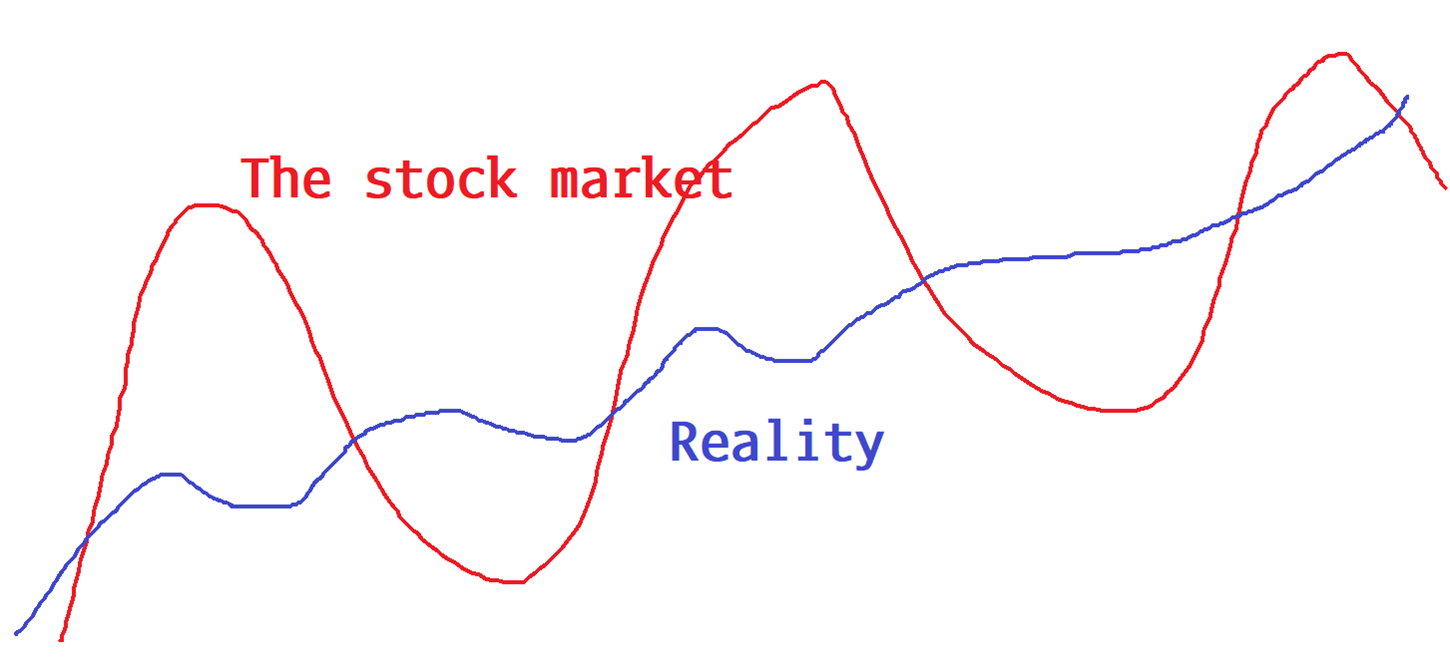
Narrative helps you zoom in and see the world through a practical lens, and it helps you avoid arbitrary valuations, which are directionally useless much of the time. This next graph gives you a sense of how fundamentals move over time, vs. asset prices. Focusing on the blue line too much gives you a false sense of reality and you need to have a framework that also allows you to navigate the movements in the red line.
A theoretical look at how an asset price and the asset’s fair value might change over time
That graphic is an optimistic view of how things play out. There is no law of finance that says price has to revert to your favorite measure of fair value. Maybe your measure is wrong. Maybe your framework is wrong. Valuation can be totally irrelevant for literally years or even decades at a time. Researchers have claimed the Swiss franc is overvalued almost from the day I started trading FX in 1995. And yet it continues to rally, year after year. Valuation is imprecise, sensitive to assumptions, and only useful as part of a more comprehensive approach.
Also worth noting: Throughout the 2010s, fundamental analysis was also challenged by zero interest rate policy and frequent liquidity injections by central banks. When money can be borrowed for free, the normal financial discipline pressure on companies is less powerful. Weak companies can survive thanks to cheap borrowing and defy traditional market pressure.
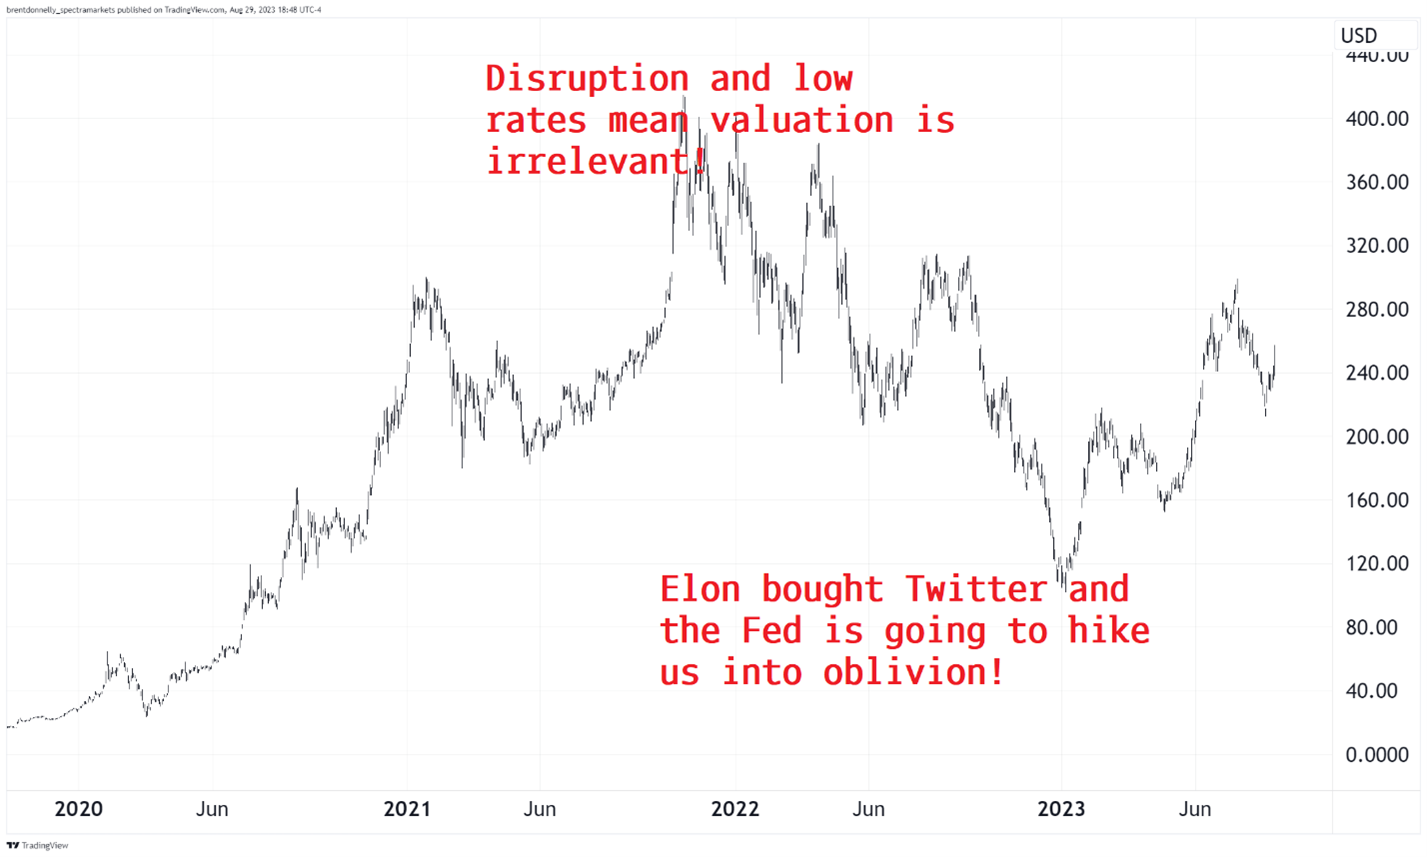
Narrative is always relevant. Every day. On every time horizon.
Did Tesla go from being the biggest disruptor to a disaster waiting to happen in 2022? Not really. The narrative got wildly overcooked one way, then reverted back to reality, then got wildly overcooked the other way.
TSLA’s up trend has been marked by extreme narratives in both directions
Here’s another wonderful explanation of the tension between long-term valuation and short-term price movements. Again from Keynes:
It might have been supposed that competition between expert professionals, possessing judgment and knowledge beyond that of the average private investor, would correct the vagaries of the ignorant individual left to himself. It happens, however, that the energies and skill of the professional investor and speculator are mainly occupied otherwise. For most of these persons are, in fact, largely concerned, not with making superior long-term forecasts of the probable yield of an investment over its whole life, but with foreseeing changes in the conventional basis of valuation a short time ahead of the general public.
They are concerned, not with what an investment is really worth to a man who buys it “for keeps”, but with what the market will value it at, under the influence of mass psychology, three months or a year hence. For it is not sensible to pay 25 for an investment of which you believe the prospective yield to justify a value of 30, if you also believe that the market will value it at 20 three months hence.
Thus, the professional investor is forced to concern himself with the anticipation of impending changes, in the news or in the atmosphere, of the kind by which experience shows that the mass psychology of the market is most influenced.
If you have been in finance for a while, you may have noticed that discussions of narrative have become more popular in recent years as Ben Hunt’s Epsilon Theory and books like Narrative Economics by Nobel Prize-winning Yale economist Robert Shiller view markets through a lens that favors stories over data. If you are keen to learn more about narratives and the role they play in markets, you should check out www.epsilontheory.com. Also note that at the end of this lesson, we have a Learning from Legends video with the Founder of Epsilon Theory, Ben Hunt. The video features Ben and I talking about how he measures, analyzes, and forecasts market narratives. Be sure to check it out.
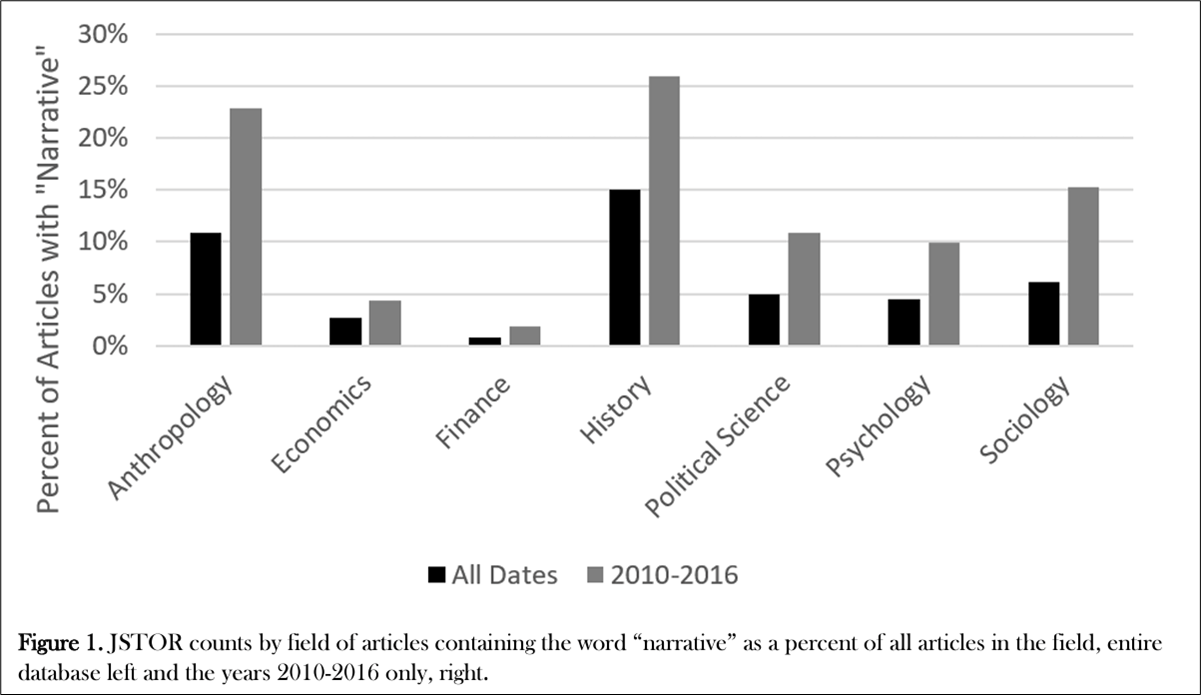
Despite the popularity of narrative in certain financial market circles, the fields of finance and economics have been slower than other disciplines to embrace narrative as a meaningful analysis tool. Narrative analysis in finance is still niche.
See this graphic from Robert Shiller, for example:
https://www.almendron.com/tribuna/wp-content/uploads/2017/04/d2069.pdf
A better understanding of narratives will give you an edge over your competition in capital markets, economics, and trading.
Now that you have an idea of why you must understand the narrative cycle, let’s dig into how you do it.
The standard narrative cycle
Professional analysts, economists, and traders have an expert-level knowledge of the primary narrative and competing sub-narratives that drive their markets. They understand the importance of the story the market is telling, and they can see, hear and feel when that story is changing. They know what is common knowledge, and what is not.
“In my whole life, I have known no wise people who didn’t read all the time—none, zero. I’ve gotten paid a lot over the years for reading through the newspapers.”
– Charlie Munger
Here’s how Stan Druckenmiller explains it:
I think the great thing about my original mentor Spiros Drelles in Pittsburgh was he made me focus on what moves the stock price. Like you can’t just say, “Okay this is a great company, and the earnings are great…”
Tell me how people are going to think differently in 18 or 24 months about the situation than they’re thinking now. That would be my number one advice to young people. Do not invest in the present. The present is not what moves stock prices, change moves them, and I want you to try and envision a different world in a year and a half from now, and where these security prices would trade versus now given the world you envisioned.
This quote speaks to the multi-level challenge of analyzing narrative. It’s not enough to simply take the current narrative and extrapolate it. You need to fully understand the current narrative but then have a working model of how and when that narrative could change.
You must surf the changing narratives as they evolve. The rest of this lesson will help you solve that enormous challenge.
Narrative analysis is not about studying what you think is the story. It’s about understanding what the market thinks is the story. Very often, the market will ignore facts and variables that you might think are important. You could be worried about the US budget deficit, but if nobody else is worried about it, it’s not a useful part of your narrative framework for the US dollar right now. File it under “potential future narratives that I think could be important” but don’t keep obsessing over it if nobody else is talking about it and the market is not trading it.
To be clear, you should always have a sense of the following in the economies and markets you follow:
- What stories have been driving my markets recently?
- Are we early, middle, or late in those narrative cycles?
- What narratives could become important in the future and therefore should be on my radar going forward?
When done well, narrative analysis is a coherent and fluid combination of ever-changing macroeconomic fundamentals and behavioral analysis. It is often about nailing down the one, most important story the market wants to trade right now and then realizing when that story is close to its expiry date.
Understanding the narrative cycle is important because when you are good at it, it is a critical tool that helps you identify both trends and turning points. You see the psychology and storytelling at work in the market and you can predict where price is going to go. Understanding the narrative cycle also steers you clear of dangerous traps like shorting something simply because it’s overvalued or buying a stock simply because it’s cheap. Without more tools in your belt, these approaches will lead to persistent underperformance and failure.
This is why even the king of discounted cashflow analysis, NYU Professor of Finance Aswath Damodaran, incorporates stories into his analysis. DCF can be a tool, but on its own, it’s often more dangerous than useful. Here’s a graphic from one of Professor Damodaran’s presentations. It gives a nice simple conceptual framework that shows you how to combine numbers and stories.

https://aswathdamodaran.substack.com/p/facebook-meta-lesson-3-tell-me-a
How to understand and predict the Narrative Cycle
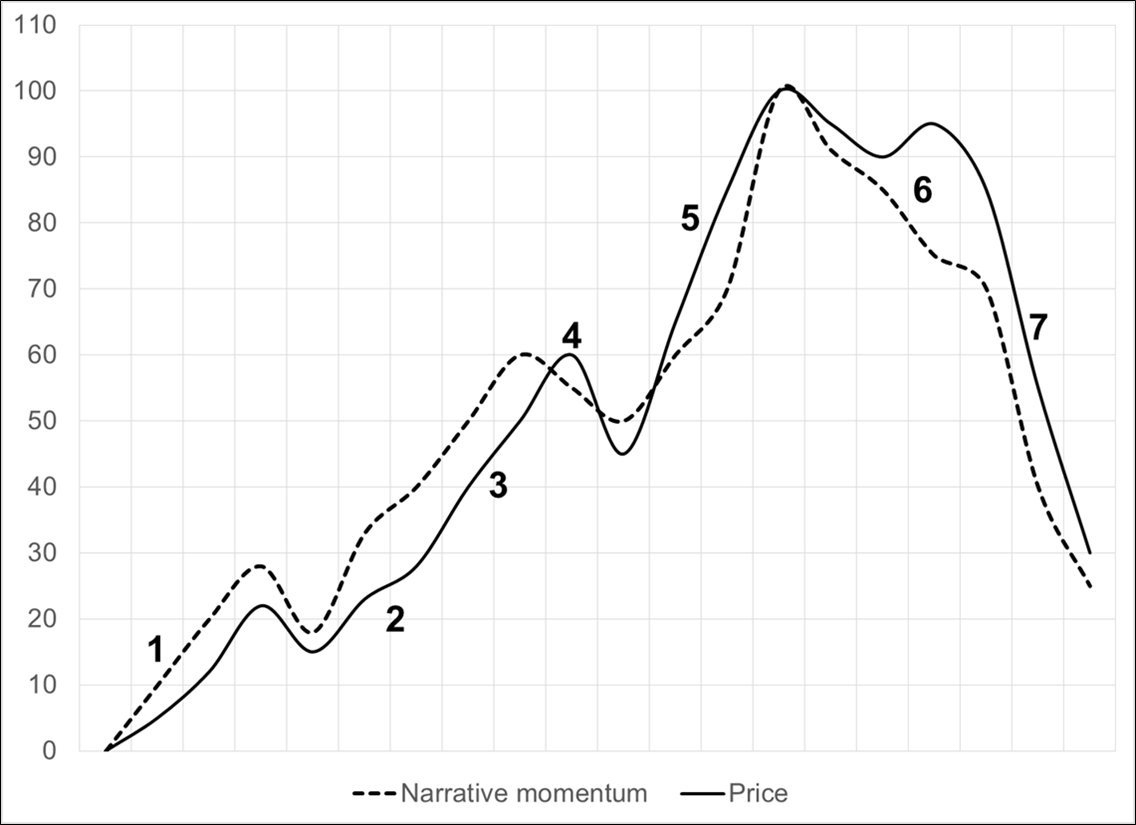
Here is a stylized view of the typical narrative cycle:
I will briefly describe each phase of the narrative cycle below. You might recognize this as similar to other cycle analysis like the panic/euphoria model (which better describes bubbles, not standard narrative cycles) or the famous SELL? SELL? SELL? BUY! BUY! comic by Kal.

It is important to note when reading this that the narrative cycle operates on many time fractals. There are the big macroeconomic narratives, but there are also sometimes much shorter narrative cycles that can last as little as 24 hours. Often news or economic data will appear to be important but then run out of steam very swiftly as the market pivots back to the main story. For example, you will often see a specific narrative form in the days leading up to an economic event. This narrative will accelerate as the event nears and excitement builds, then will dissipate after the event.
Picture a web of interconnected narratives with one or two dominating and the rest all swirling around and vying for attention. The goal is to determine what stories are driving your market now and what stories will jockey for position and come out ahead in the future. Traders with more experience will recognize the stage of the narrative intuitively and will often have a strong sense of when a story is running out of gas as the signposts are often similar at various stages of the narrative cycle.
Ben Hunt (Epsilon Theory) is the king of understanding, parsing and forecasting the narrative. Here’s how Epsilon Theory’s Narrative Machine processes and displays financial market narratives:
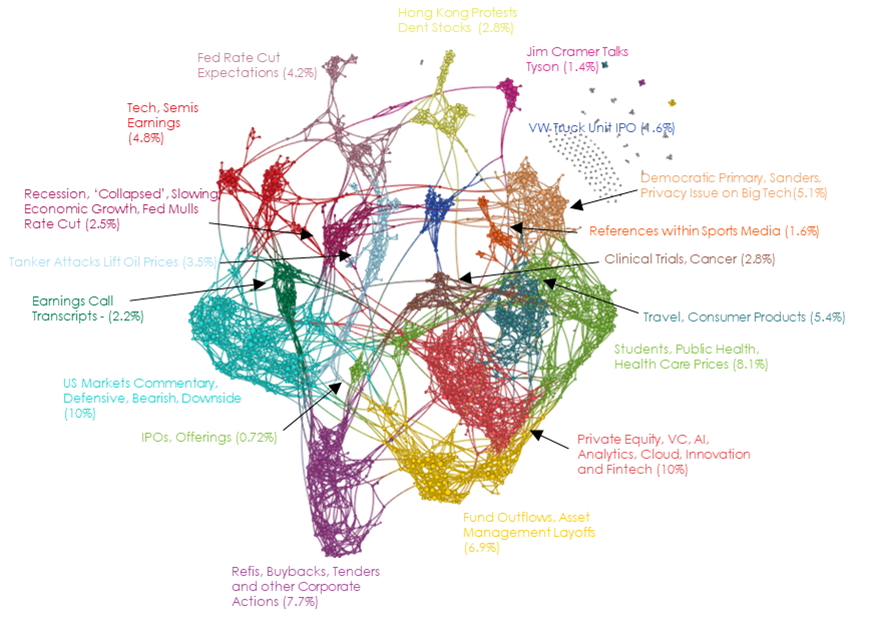

https://www.epsilontheory.com/the-narrative-machine/
You don’t need to understand the details of the graphics, but they are useful visuals because they show how narratives cluster and change over time. This is a good model for how you can think about market and economic narratives in your head. We don’t witness a bunch of overlapping narratives; it’s a bunch of distinct narratives, and each market embraces one or maybe two narratives at a time and then transitions fairly quickly from one narrative to the next.
Each stage of every narrative cycle will look and feel familiar in many ways, even when the stories themselves are radically different each time. Kind of like a Hollywood movie that follows a standard three-act structure. Sure, the characters, setting and plot vary, but the arc of the story tends to look pretty consistent every time.
The standard movie script follows this arc
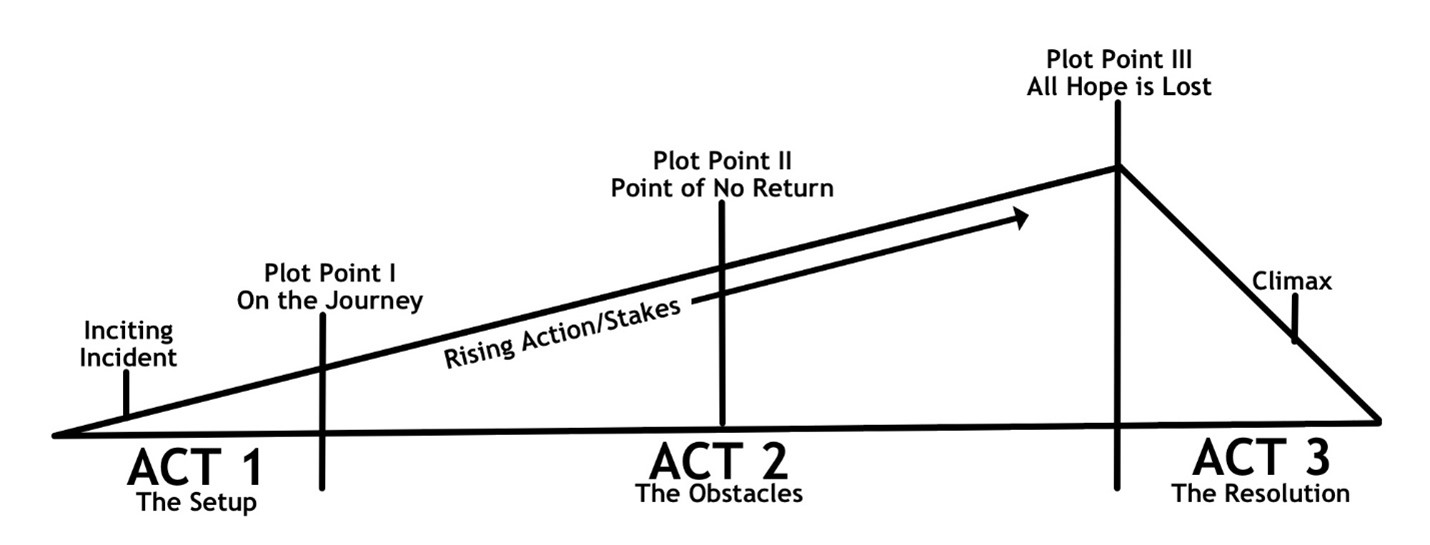
Like Hollywood movies, market narratives follow a standard arc.
Let’s go through the seven stages of the narrative cycle described by our chart of the typical narrative cycle. So that you don’t need to scroll back, I’m dropping the chart in here again, and next to it is a chart of crude oil from late 2020 to February 2023. The rally and subsequent fall in oil provides a textbook real-world example of how the narrative cycle interacts with price and with news to create a bull market and subsequent failure.
Commodity markets can often be too small to handle the enormous flows from financial speculators and as such you will often see textbook narrative cycles in commodities as speculators front run the real flows and changes in supply and demand in massive size.
A stylized view of the typical narrative cycle and the 2020-2023 cycle in crude oil
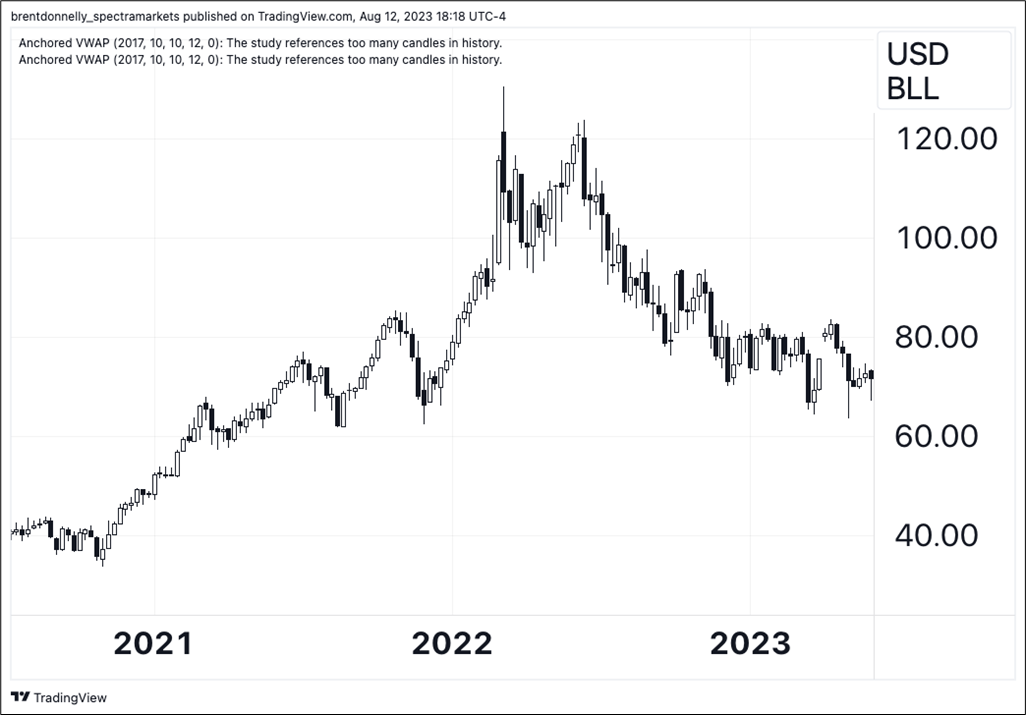
Stage 1: Under the radar. At this point, there is a new narrative forming, but very few traders have heard about it. Some smart, independent thinkers and research-oriented people are talking about it and a few contrarians are putting on the position. There are usually a few pullbacks as initial believers have low confidence. Traders testing the waters tend to get bored or jiggled out because the price is not moving their way, or they just figure they’re too early and don’t want to waste time on a narrative that is not valid.
Oil $35. In late 2020, the market was still worried about global demand and had not yet caught on to the idea that inflation was coming. Despite optimism over COVID vaccines, and huge rebounds in other financial markets, there wasn’t much interest in oil as much of the world was still shut down.
Stage 2: Momentum Builds. At this point, the narrative goes a bit viral (at least among professionals or experts) and price jumps or falls to reflect the new zeitgeist. The narrative cycle chart we are using here shows a bullish story driving the price of an asset upward, but you can flip the whole thing over for a bad news narrative.
Remember that at every stage of the narrative cycle, there is a dynamic interplay between price and narrative. The story drives the price, and the price drives the story and often it is hard to tell which one is causing the movement. For example, say a stock has a good story but it’s still in Stage 1 of the narrative cycle. Nobody is paying attention. A fund manager reads some three-week old research and decides he loves the story. He starts buying stock and liquidity is poor. The price rallies 4%. Some stale shorts stop out and the fund manager keeps buying and soon the stock is up 11% over the course of two days.
Because the stock rallied, it appears on a few radars (many firms and individuals run scans for stocks with unusual volatility) and this generates some new interest. Traders and investors look it up and some of them like what they see (great story!) and that triggers more buying. In this little description, the price is now feeding the narrative, not the other way around. The narrative already existed three weeks ago.
As momentum builds and the stock hits (for example) a 60-day high, trend followers and systematic hedge funds (also known as commodity trading advisors, or CTAs) will start to buy. This feedback loop where changes in price influence investor expectations, which influence the narrative, which influences the price, is a form of reflexivity. Reflexivity is a concept from sociology that was transferred over to finance by George Soros. It is a fancier way of saying “circularity” or “feedback loops”.
Applying this concept to current markets:
Try to think of a stock, cryptocurrency, or other asset that is in Stage 2 right now.
Oil rallies to $45. The end of 2020 marked a big shift in sentiment. Many US states were opening up, vaccines were in production, monetary policy was historically loose, and oil’s early movers could see that fiscal policy was about to get wild. Hedge funds and speculators with good instincts were starting to accumulate oil as an inflation hedge and as a play on a rebound in global transportation and travel.
As momentum buying feeds the narrative and feeds on itself, we enter Stage 3.
Stage 3: The Primary Trend. This phase is where the narrative drumbeat takes hold and there are more and more converts lined up behind the apostles from Stage 1. Pullbacks are bought and the news reinforces the price which reinforces the trend which reinforces the buying. This stage is often the most profitable in a strong narrative because Stage 3 can last a surprisingly long time. Just because a narrative is well-known, that does not mean it’s exhausted.
Stage 3 involves a lot of hype, usually from financial media and tourists who have joined the party fairly early. Again, just because there is hype, don’t think the story is over. The hype phase can accompany dramatic price moves as demand outstrips supply for an extended period and the market ignores bad news and doubles down on good news.
Oil rallies to $70. Spring 2021, Russia started moving troops towards the Ukraine border and every type of analyst could now see the attraction of long oil. Global demand was coming back, geopolitical risks were increasing, the Fed was still super loose, and oil was in a nice uptrend. Whether you traded global demand, geopolitics, monetary policy, technicals, or trend following, long oil made sense at this point. Everybody in the pool!
Stage 4: First cracks. At this stage, some cracks appear. Bad news hits that threatens the narrative. The story is crowded, and early entrants think maybe the story is over, so they take some profits. There is a meaningful pullback in price. This pullback shakes off the weaker and more recent buyers but those that believe in the narrative appear on the bid and the price stabilizes. Slowly, the importance of the bad news dissipates and price climbs back towards the highs.
Oil up to $80 then quickly back down to $60. Late 2021 saw two huge selloffs in oil, including one as the Fed abandoned their view that inflation was transitory. Markets first saw this as bearish oil because Fed hikes could put pressure on demand. But then, the logic changed and the view was that if inflation is going to keep ripping, oil and commodities are the best hedge. Late buyers got shaken off and the true believers were rewarded as they bought the dip.
Stage 5: The final hype wave. As price breaks through and makes new highs, the narrative often goes into overdrive. The narrative becomes common knowledge in this phase and at that point, the narrative is close to priced in. It is very difficult or perhaps impossible to make money or unique forecasts using the same information and thought processes as everyone else. It’s hard to get rich doing what everyone else is doing. You must have some unique insight to generate alpha in markets.
Longs are emboldened by the price action and a strong feeling of FOMO comes over anyone who is not participating. Depending on the story, you will often see the narrative cross over from financial media to the mainstream media at this point if the narrative is interesting and important enough.
Non-experts will join the party (retail and macro tourists), and this will push price aggressively higher. Stage 5 is usually the most surprising and volatile part of the narrative cycle as sellers step away and buyers get desperate. In Elliott Wave, this is also Wave 5 and Elliott Wave Theory warns that Wave 5 can often be the most impulsive part of a move. This stage is often characterized by choppy, jumpy moves, euphoria and overshooting. Trend following systems add to long positions all the way up.
Oil spikes to $130. The day Russia invaded Ukraine was the cycle high in oil. This is a great example of the counterintuitive market reality that price usually puts in the highs on good news, not bad news. The market was already super hyped up before Russia went in, and the attack itself drew in a final wave of tourists buying oil above $100 because “geopolitical risk!” and such. A lot of ridiculous and panicky price targets came out at this time and some analysts were declaring that oil would replace the US dollar as the global store of value. All typical signs of a peak.
Stage 6: The Peak and the Turn. The top in the narrative and price can be a long, drawn-out process or an impulsive overshoot and collapse. Often, it’s like the climax in a movie with a huge flashy rip higher followed by a rapid reversal that catches everyone on the wrong side.
If you have participated in a good chunk of a trend, identifying when it has entered Stage 6 can be career-defining. Stage 6 is the tail end of the trend. Risk/reward is poor and contrarian strategies can often yield better returns than trend following tactics at this point in the cycle. Most strategists, traders, and economists hang around too long in their good calls and end up giving back a meaningful chunk of gains after the turn.
Three signs that you might be in Stage 6
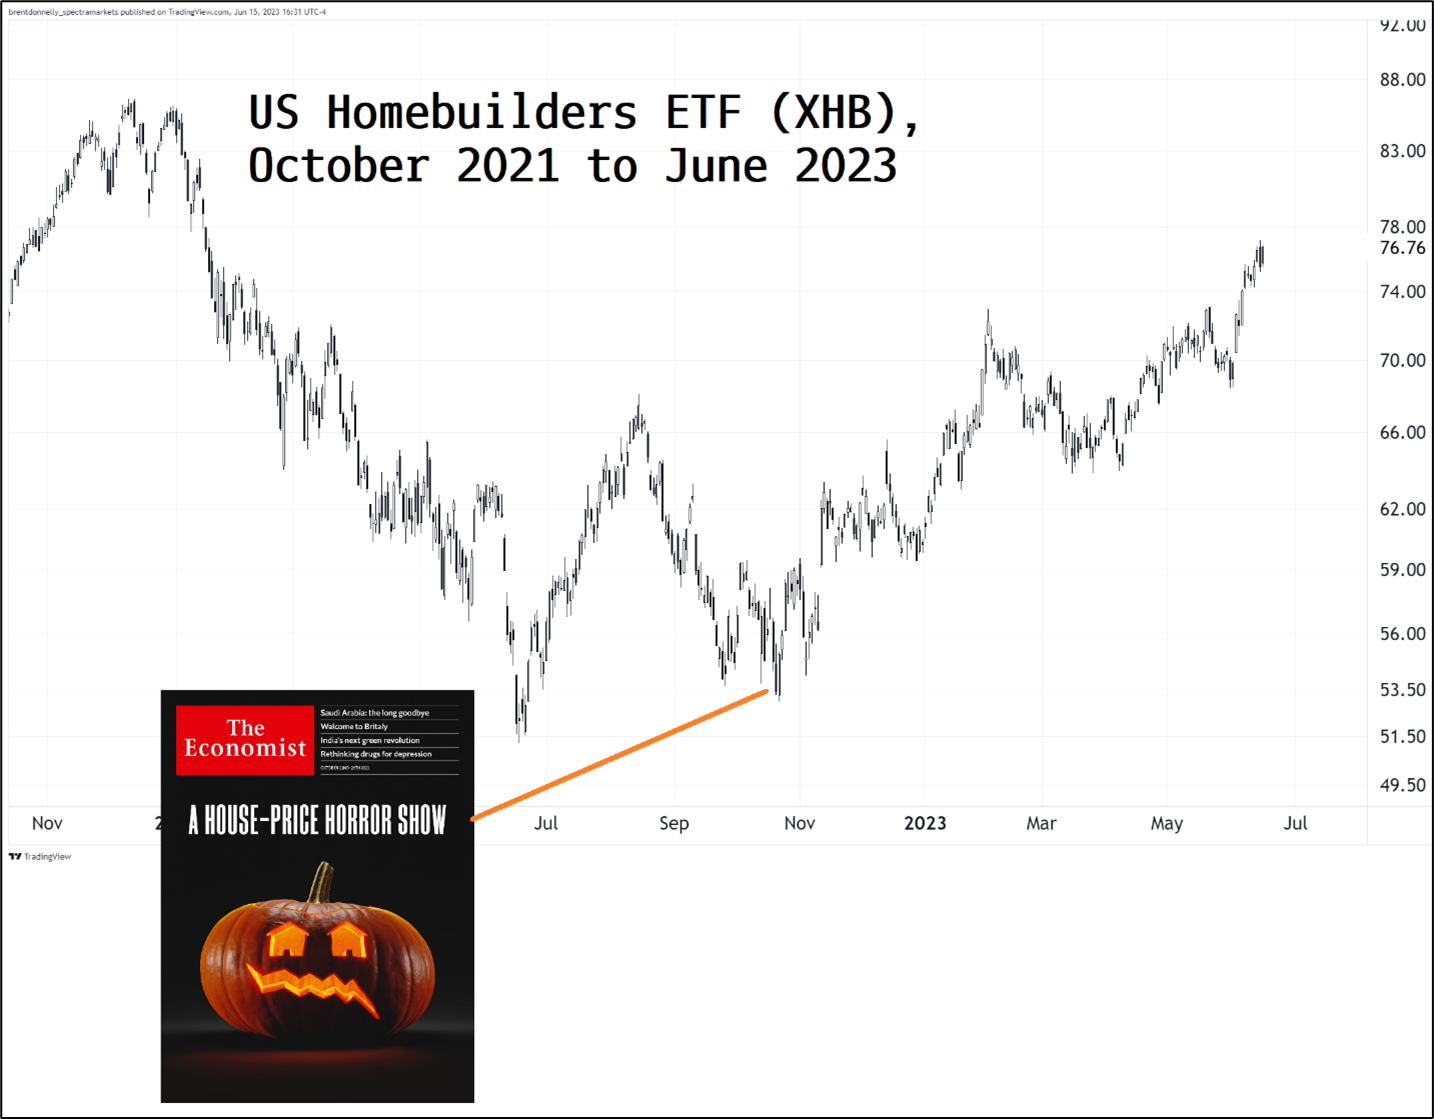
One: The story is on the front page of a non-financial magazine like The Economist or Time. For example, this was the cover of the Economist right at the peak of the euro-negative narrative in 2022:

July 22, 2022
Magazine covers, specifically non-financial magazine covers, are a great way to see that a financial market narrative is now mainstream, priced in, and well known. Here’s a sub-lesson on that before we continue.
The Magazine Cover Indicator
Anecdotal evidence like magazine covers can offer useful information. The problem with anecdotes is that they are prone to sample size issues, confirmation bias, and cherry-picking. If you’re always bearish stocks, for example, you will see anecdotal evidence of a top almost every day. If you think tech is a bubble, you will see anecdotal signs of overconfidence and tech hype all over the place. If you’re a crypto hater, you will find plenty of anecdotal reasons to get short crypto. Etc.
Anecdotal evidence is also prone to apophenia, which is the word for human beings’ predisposition to see patterns everywhere.

What face? I don’t see a face.
The human brain is designed to see patterns, and often sees them where none exist. If you are bullish, you will see bullish evidence all around you, and miss the bearish evidence.
While trying to incorporate anecdotal evidence into your framework can lead to biased decision-making, it can also give you a simple and potentially reliable way to measure social mood and identify narrative peaks and extremes in an asset class. If you ignore anecdotal evidence, you ignore the canary in the coal mine and you may miss obvious warning signs of trend exhaustion and peaks or troughs in the zeitgeist / hype cycle.
The Magazine Cover Indicator is a belief commonly held by financial market participants that when a financial story or market theme is displayed on the cover of a magazine, that theme or the related trend is near exhaustion. In other words, magazine covers are believed to be reverse indicators.
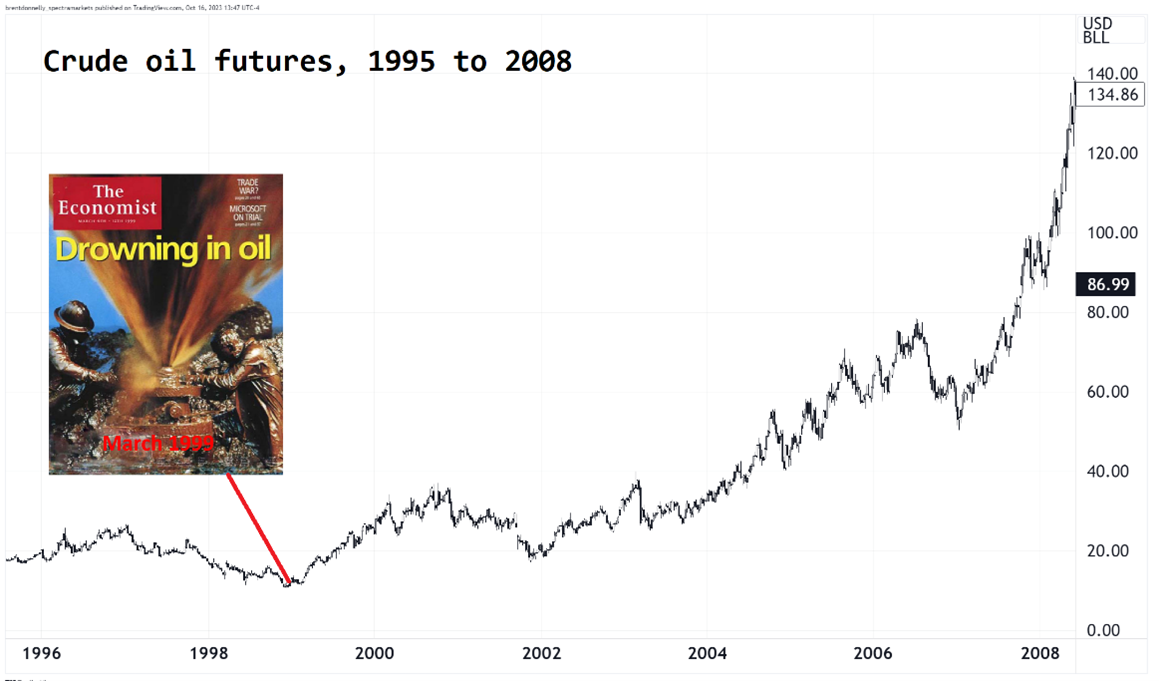
Two of the most famous examples are when BusinessWeek’s cover screamed: “The Death of Equities”, at the stock market lows in 1979 and when The Economist proclaimed the world to be: “Drowning in Oil” just as oil bottomed in 1999.

The premise behind the indicator is that when a mainstream journalist or editor finally devotes a cover to a market trend, country or person, the story or theme has been in vogue for some time and is likely past its peak. Positioning and sentiment should already fully reflect the story on the cover of the publication and the story should be priced in.
In other words, by the time a journalist writes about a trend, the majority of the move has already happened. Also, there is mean reversion at work. An asset or asset class has to move substantially before it makes it onto a magazine cover, so by that point it’s almost surely overbought or oversold. Mean reversion also drives the Madden Curse, The Stadium Curse, and the Sports Illustrated Jinx. When something massively outperforms, it’s more likely to underperform in the future due to simple mean reversion.
The problem with an unscientific indicator like this is that it becomes a part of market lore. Traders remember when it works and conveniently forget when it does not. Selection bias and cherry-picking are a problem. Then, every time a new magazine cover hits, people assume it is contrarian, even when there is no data to back this up — it’s just something people assume is true. It is easy to point to a cover story and draw conclusions, especially in hindsight.
In 2016, and again in 2021, Greg Marks and I did a study on the Magazine Indicator and found that it has robust predictive power. You can read my full article on the topic here.
Long story short is this: Time and the Economist magazine covers are empirically a good reverse indicator. The reversal starts pretty much right after the cover comes out (on average) and tends to produce the best profits one year later.
When a market story hits the cover of a mainstream magazine, watch out.
Here are three more examples of the magazine cover indicator in all its glory:


Important note:
Not all publications are reverse indicators. Barron’s, for example, is not. See here for a quantitative study and explanation.
Two: A second tell that you are in Stage 6 is when you see smart money trying to capitalize on the narrative, either by cashing out, or by selling new products into the frenzy. Smart money doesn’t look for exit liquidity when prices are low, or nothing is going on. They look to sell to the late arrivals buying the mania at the highs.
A great example of this is when Glencore sold its initial public offering in 2011. Glencore is one of the largest commodity producers in the world and in 2011 the world was in the midst of the second wave of an extreme bull run in commodities known as the Commodity Supercycle. Chinese and speculative demand had pushed commodity prices to new peaks and investor appetite for anything commodity-related was insatiable.
The insiders at Glencore were smart and realized that if they ever wanted to sell their company (which was massive at the time, valued at about $60B) this was a great time to do so. It is not hindsight to talk about how they sold the top—many observers and analysts (including me) pointed out at the time that the IPO could be a textbook sign of a top for commodities.
Take a look at the next chart which shows the Glencore IPO marked on a chart of the CRB. The CRB is the benchmark commodities index. Note how the Glencore IPO marked the exact top tick for commodity markets.
Daily CRB Index, 2003 to 2015

If you bought the Glencore IPO on the day it went public, you were left holding the bag as the insiders used the IPO as exit liquidity. The stock went straight down from 2011 to 2015 and lost more than 80% of its value.
Let’s look at two more examples.
When an exchange launches a new product, they are often trying to monetize a popular narrative by offering more ways for retail latecomers to get involved before the narrative fizzles. New exchange products are always a response to strong demand, and they often come out at the worst possible time for investors. They are an important sign you are in Stage 6. Here are two examples from bitcoin.
Bitcoin bubble of 2016/2017
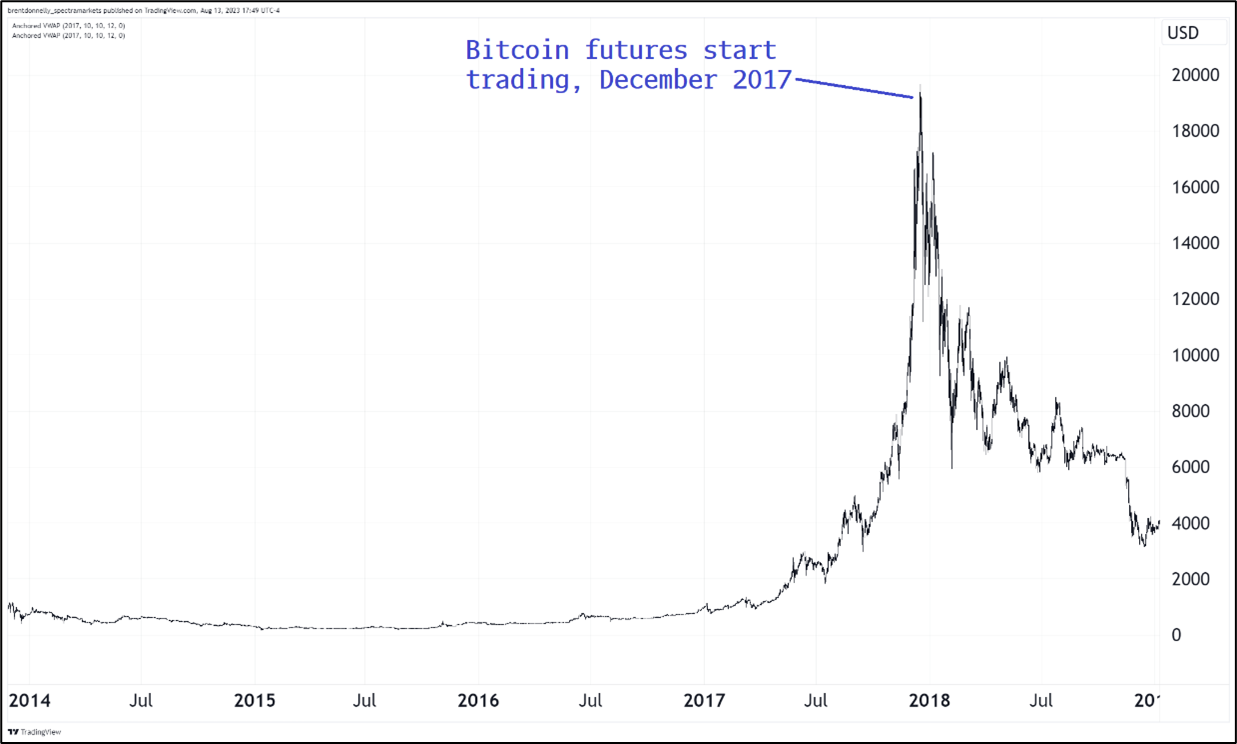
Bitcoin bubble of 2021

You can’t make this stuff up!
Three: A third sign of Stage 6 is when changes in supply and demand occur due to the change in the market price of an asset. The price rise itself can change the supply and demand dynamic at this stage. There is a saying that “the best cure for high prices is high prices”, which means that higher prices ultimately reduce demand and increase supply—and that eventually leads to lower prices.
For example, when the price of oil rises or falls gradually, consumer and producer behaviors do not change much. On the other hand, when the price of oil explodes higher from $50 to $120 (like it did in 2008), producers rush to bring on new supply and consumers simultaneously cut their demand because they can’t afford to fill up their SUVs. They drive less. These shifts in supply and demand are not instantaneous, so prices can continue to rise even as new supply works its way into the system and demand disappears. Then, suddenly, the new supply runs into falling demand and prices whoosh lower.
For example, in 2021, the wild rise in AMC stock led management to issue more and more shares (new supply). Each rally of a sufficient magnitude in AMC triggered a new, massive cascade of supply from management. The cure for the high price of AMC stock… Was the high price of AMC stock. Whenever the stock went up, it triggered secondary issuance.
Be sure to understand what price levels in your market might lead to major or non-linear changes in supply or demand. This is where reading voraciously and doing the work to be an expert in your market really pays off. You will notice the way large price changes in your market change supply and demand behaviors.
Oil double top at $120. Once a market is priced for either perfection or catastrophe, it is very difficult for the actual outcome to be more perfect or catastrophic than the market’s fantastical narrative. Oil in 2022 was no exception. Russia found ways around G10 sanctions, Europe found other sources of gas, US self-sufficiency due to shale and natgas helped the global situation, there were no food shortages at all, and the most hysterical calls for a commodity-shortage catastrophe were all wrong.
Stage 7: The End. As a narrative expires, people lose interest and only those with bad discipline hang on. Shorts hammer the price down and longs slowly but surely get out. Market themes are like fashion trends. The market’s interest is fickle and limited. People get bored of a theme, and they move on. Sometimes this will be justified by fundamentals and sometimes it will simply be that a sexier, more interesting theme came along.
Oil drops back to $70. Too many people got long oil at bad levels and there was too much hype and panic and catastrophizing. The oil market is dynamic and global, and it managed to find ways to replace lost Russian supply. Speculators got caught up in a really exciting and scary story and overinvested at bad levels.
That is the narrative cycle. I am describing something clean and visible, but the tricky part is that these cycles are anything but clean and are only easy to see in hindsight. As you gain experience, though, you will start to see these cycles play out in real time and will learn to anticipate and act before the cycle moves to its next stage. Many of these stages of the oil narrative cycle, for example, were recognized by traders in real time.
Same thing with Peloton, which followed one of the most hysterical narrative cycles of all time.
Peloton Interactive (PTON) stock, 2019 to 2023

Can you stay flexible enough to recognize the signs in both directions? Many traders and investors caught the move up in oil, but very few took profit or got out in time because they were so in love with the story, they didn’t consider the fact that by the time oil opened that Sunday night after the Russian invasion… It was already up 400% from January 2021. A lot was priced in. In fact, everything was priced in. More than everything was priced in!
Moving targets
A common error made by traders and forecasters is to just keep moving their forecast and targets higher over the course of a bull market. This isn’t forecasting! This isn’t trading. This is extrapolation. Always be aware of what stage of the narrative cycle you’re in and don’t be afraid to leave the party before the cops show up. You don’t have to ride every trend to the very end.
When you gain experience in narrative analysis, it will feel less mysterious. Like once you’ve seen enough movies, it’s easy to understand the difference between the opening credits of a movie and the climactic car chase. If you know where you are in the story and understand current positioning, you will have an edge as the cycle moves from stage to stage.
Understand the stories the market is telling itself and learn to identify when the market is falling in or out of love with a narrative. In the end, everything we do in markets is in the pursuit of better forecasts, better trade ideas, and more profitable outcomes for ourselves and/or our clients.
Always think this way when you are learning new skills and tools. “How can I use this new skill / tool to make more money for the bank, myself, my clients, etc.” in the real world? Sure, analyzing markets can be intellectually satisfying, but never take your eye off the ultimate objective.
Better forecasts, better trading, better investing, better performance.
In that spirit, before we wrap things up, let’s look at two pitfalls to avoid when you use narrative analysis to make market forecasts or trading decisions.
Common pitfalls in narrative analysis
- Time horizon mismatch. Know your time horizon! Very often traders and even economists will fall into the trap of getting hyped up on some structural narrative that could take years to play out. Then, they will allow this super long-term view to infect their short-term trading or forecasting. If you’re a trader, make sure your views fit your trading time horizon. Don’t come up with a 10-year structural view on Canadian productivity, then go short CAD with a stop loss 2% away and wonder why the trade didn’t work out!
Your thesis needs to match the trading or forecasting time horizon that is relevant to your job. Unless you are a buy and hold investor who only cares about your retirement account, it is very, very rare for any 10-year or 20-year thesis to be relevant. If you’re a trader or forecaster, match your analysis to your trading or forecasting time horizon. If you’re short Chinese stocks with a 2-month view, don’t tell me you’re short because of China’s bad demographics. That’s a time horizon mismatch.
- Focusing too much on idiosyncratic single-market narratives and missing the bigger picture. A fatal mistake made by many crypto bulls in 2021 was to focus too much on the bullish crypto adoption narrative while failing to see the bigger picture story of a liquidity-driven speculative mania in all assets. Cryptocentric analysts saw all the new crypto adoption and the flood of institutional money into crypto and assumed this was validation of the crypto bull narrative. In fact, crypto adoption was no different from oil speculation, Peloton stock buying, or worship of Cathie Wood. When there are trillions of USD sloshing around, every asset goes to the moon, and everyone is a genius. More astute observers saw the writing on the wall in November 2021 when the Fed abandoned their view that inflation was transitory and indicated rate hikes and quantitative tightening were in the cards for 2022.
You will see a similar error in many specialized markets. Copper traders will see extreme shortages of copper in London inventories and be max bullish without considering that perhaps a balance sheet recession and real estate meltdown in China might be more important. You can’t just look at your market’s narrative in isolation. You also always need to have at least a basic grasp of the primary global macro narratives and the big central bank narratives. Otherwise, you will be calibrating your weathervane to local winds today and get blindsided by a hurricane tomorrow.
Conclusion
In the very long run, theory suggests that asset prices will converge towards some measure of fair value. But since nobody can agree on what fair value is, and humans are predictably irrational, you cannot simply conduct fundamental analysis and then hold an asset forever without narrative analysis and risk management frameworks. Narratives can dominate price movement for longer than you can stay employed as a fundamental analyst, forecaster or trader… You must understand how narrative cycles drive asset prices.
“How to understand the narrative” is fairly easy to explain but requires significant time and effort from you to reach expert-level proficiency. You will notice over time that your ability to read the story the market is telling gets better and better. Soon, you will start to get a sense of what is about to happen… Before it happens.
This lesson is a first step towards mastering the narrative cycle in the economies, securities, and markets you follow. Learn to accurately explain what narratives are driving asset markets and to predict the evolution and changes in narrative and you are a big step ahead of most of your competition.
If you’re viewing this lesson as a sample,
Click here to watch the sample Learning from Legends video with Dr. Ben Hunt.
Otherwise, continue with the course below.
Recommended reading for this lesson: